
🕹 Challenges & Exploration
You as a student need to fill in these assignments and learning goals by yourself. At the start of each next chapter the lecturer will, together with class, review these in an overall sense but will not give the full, word-by-word, solution for you to simply sit back and download. So it is important that you have completed the work yourself before the review starts in class and you can correct where needed.
You are not allowed to use AI like ChatGPT or Bing Copilot on the exam, but you are here! Leverage these new tools to speed up and give structure to your notes and documents. For example, ask to put material in Markdown format!
📝 After completing this chapter, you should be able to:
- Describe what load testing is, why it is useful and when it can be done in a Devops Lifecycle
- Describe what Locust is and how it works using Python
📊 Extra dashboard panels in Grafana based on Prometheus metrics
Look up a way to create an extra panel in the Grafana dashboard that shows the total HTTP requests made.
Make sure you can see:
- the total overall status code
2xxrequests tolocalhost:8000/ - the total overall status code
4xxrequests to any endpoint
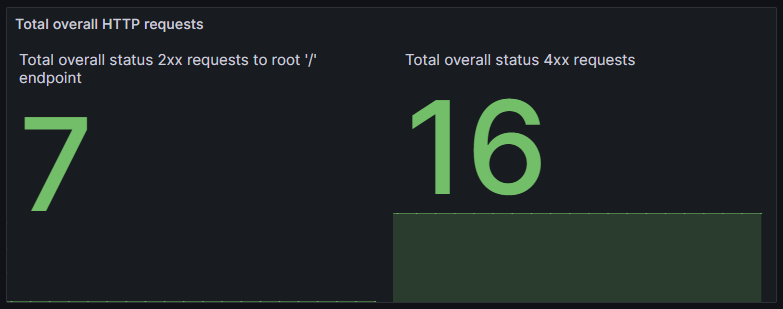
You can look at the localhost:8000/metrics endpoint for info in the available metrics.
Test it out manually by quickly refreshing the browser page with localhost:8000/ for the 2xx status code and localhost:8000/nopage for the 4xx status code.
🧪🥏 Load testing with Locust
 Look up what:
- Load testing is in a testing context
- Locust is as a testing tool
Then use Locust with Python in a new plain Python project to load test the basic API we hosted in the example with Prometheus.
Lastly, make use of the load testing capacity of your new Locust Python project to try and look the changes in the panel you made earlier in the previous challenge.