
📝 After completing this theory chapter, you should be able to:
- Explain what the Monitoring step in the DevOps lifecycle is and how it can be tied to the Plan step
- Explain the use and importance of logs in the context of monitoring
- Describe how the Python logging module makes logging possbile and uses different levels and handlers to work
- Explain a given Python file that uses the logging module
- Explain the use and importance of metrics in the context of monitoring
- Give examples of basic operational metrics
- Describe what Prometheus and its main features are
- Explain how Prometheus works in a deployment with a FastAPI container it scrapes and Grafana container that makes a dashboard of its data
- Explain a given prometheus.yml configuration file
- Explain what KPI's and Service levels in SLAs are and how they relate to monitoring
- Describe the use of alerts in the context of monitoring
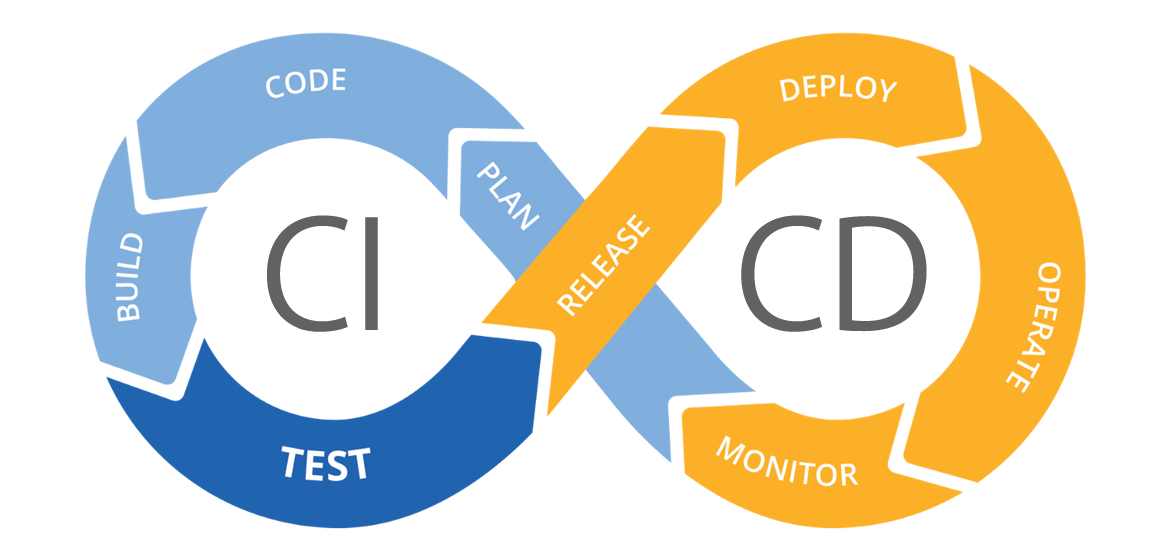
Monitoring: Combining logs, metrics and alerts
The Monitoring step in the DevOps lifecycle is essential for tracking the performance and health of applications and systems. It enables teams to quickly identify and act upon potential issues, or otherwise keep an eye on the daily operation of an application or system.
Monitoring improves customer experience, business credibility, and can reduce operational costs by providing a real-time view of the development pipeline. It is key for:
- early error detection
- minimizing system downtime
- enhancing security
When an error, security issue or bug gets detected teams can go back to the Plan step in the DevOps lifecycle to start planning new code or components that will solve the issue.
This way we restart the lifecycle once again. It is the reason why the lifecycle is formed in a shape of an infinity symbol ♾.
Monitoring in depth
Within Monitoring, Logs, Metrics, and Alerts each serve a specific purpose:
📑 Logs provide a chronological record of events within the system. They are essential for understanding what has happened and are very useful for diagnosing problems or analyzing incidents after they occur.
📊 Metrics offer numerical data that reflect the system's performance and health. These include indicators like CPU usage, response times, and available disk space. Metrics give a quick overview of the system's current state and can help predict future performance issues.
🚨 Alerts are notifications that are triggered based on specific conditions, such as exceeding certain thresholds or detecting unusual patterns. They are critical for ensuring that teams can react quickly to maintain the system's performance and availability.
We will cover each of these with some practical examples.
📑 Logs
In the DevOps Monitoring step, Logs play a critical role in recording and preserving the sequence of events that occur within an application or system. They are fundamental component for maintaining the health, security, and efficiency of any digital system. They serve as a vital diagnostic tool and a historical record of the information that developers and operations teams rely on to understand the behavior of the system and diagnose issues.
In essence logs are the chronicle of an application's life. They provide a time-stamped account of events, errors, and operations that occur within a system. Here's a more detailed look at their importance:
1. Debugging: Logs are invaluable when it comes to debugging. When an application behaves unexpectedly or encounters an error, developers can sift through log files to pinpoint the exact moment things went wrong. This allows for a targeted approach to problem-solving, rather than a broad sweep.
2. Performance Checking: Logs can also be used to look at an application's performance over time. By analyzing logs, teams can identify performance trends, such as memory leaks or slow database queries, and address them before they become critical issues.
3. Security Auditing: Security is another area where logs play a vital role. They can record access attempts, user transactions, and changes to the system, providing an audit trail that can be used to detect unauthorized access or other security breaches.
4. Compliance: Many industries are subject to regulations that require the retention of logs for a certain period. These logs must be stored securely and often need to be readily accessible for auditing purposes.
5. Business Analytics: Logs can also be mined for business insights. For example, web server logs can reveal user behavior patterns, popular content, and potential areas for site improvement.
6. Incident Response: In the event of a system failure or breach, logs are often the first place responders will look to establish a timeline and understand the size of the incident.
🛠 A practical example with the Python logging module
To delve deeper into this concept, let's consider the Python logging module as a guiding example.
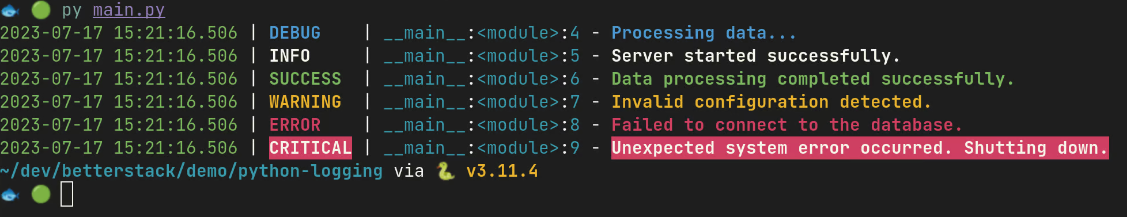
logging module. You can see the different level of log entries on displayThe Python logging module is a versatile and widely-used facility that provides a flexible way for applications and libraries to handle logging. It is part of the standard Python library, which means it's readily available and does not require additional installation. This module defines functions and classes to implement an event logging system that is simple to use yet powerful enough to meet the needs of most applications.
Here's an overview of the logging levels provided by the Python logging module, each designed for different use cases.
Try this out by creating a new plain Python project and pasting this into the main.py:
import logging

# DEBUG: Detailed information, typically of interest only when diagnosing problems.
logging.debug('This is a debug message')

# INFO: Confirmation that things are working as expected.
logging.info('This is an info message')

# WARNING: An indication that something unexpected happened, or indicative of some problem in the near future.
logging.warning('This is a warning message')

# ERROR: Due to a more serious problem, the software has not been able to perform some function.
logging.error('This is an error message')

# CRITICAL: A serious error, indicating that the program itself may be unable to continue running.
logging.critical('This is a critical message')
The logging module provides a hierarchy of logging levels, allowing developers to specify the severity of the events they are logging:
- DEBUG: The lowest level. Used for small details. Typically, these messages are only needed when diagnosing problems and are not usually logged in production.
- INFO: This level is used for general system information. These messages might state that a particular process has started or completed successfully.
- WARNING: This level indicates a potential issue that should be looked into. It is not necessarily an error, but something that might need attention in the future.
- ERROR: This level is used when the software has not been able to perform some function due to a more serious problem.
- CRITICAL: The highest level. Indicates a serious error, suggesting that the program may not be able to continue running.
Expanding the logging functionality
The logging module is designed to be simple for basic use cases but also provides a wealth of functionality for more complex scenarios. For instance, you can configure different log handlers to send logs to various destinations, such as a file or a remote log aggregation service. You can also set up filters to control which log messages are output and formatters to customize the log message format.
In practice, using the Python logging module involves creating a logger instance and then calling its methods to log messages at different levels. Here's a basic example, edit the main.py again:
# Import the logging module
import logging

# Create or get a logger
logger = logging.getLogger(__name__)

# Set the log level
logger.setLevel(logging.DEBUG)

# Create a file handler that logs even debug messages
fh = logging.FileHandler('myapp.log')
fh.setLevel(logging.DEBUG)

# Create a console handler with a higher log level
ch = logging.StreamHandler()
ch.setLevel(logging.ERROR)

# Create a formatter and set it for the handlers
formatter = logging.Formatter('%(asctime)s - %(name)s - %(levelname)s - %(message)s')
fh.setFormatter(formatter)
ch.setFormatter(formatter)

# Add the handlers to the logger
logger.addHandler(fh)
logger.addHandler(ch)

# Log messages
logger.debug('This is a debug message')
logger.info('This is an info message')
logger.warning('This is a warning message')
logger.error('This is an error message')
logger.critical('This is a critical message')
In this example, the logger is configured to write debug and higher-level messages to a file, while only error and critical messages are printed to the console.
This kind of granularity in logging control is what makes the logging module so powerful and a go-to choice for implementing logging in Python applications. It allows developers to capture just the right amount of detail for the task at hand, whether that's during development, testing, or in a production environment.
Using something like a FileHandler makes it possible for the team to keep an archived file to go back to when there is an error or security incident that occurs during the previously mentioned Incident Response. This way they can look at the file and have more information about what to do or which new code to Plan for in the next rotation of the DevOps lifecycle.
📊 Metrics
In the DevOps Monitoring step, Metrics are the quantifiable measures that track the performance and health of applications and systems real-time.
While monitoring something like an API, there are several metrics that are crucial for operational purposes but don't necessarily align directly with business goals. Here are five such metrics you would track:
- CPU Usage: Measures the percentage of CPU resources being used by the API service.
- Memory Consumption: Tracks the amount of memory the API service is using.
- Network I/O: Monitors the amount of data being sent and received by the API service.
- Disk I/O: Observes the read and write operations on the disk where the API service is hosted.
- Container Health: Checks the status of containers running the API service.
These metrics focus more on the technical aspects of service operation rather than the business impact. They are essential for maintaining the infrastructure that supports the API but do not directly reflect the business performance or user experience.
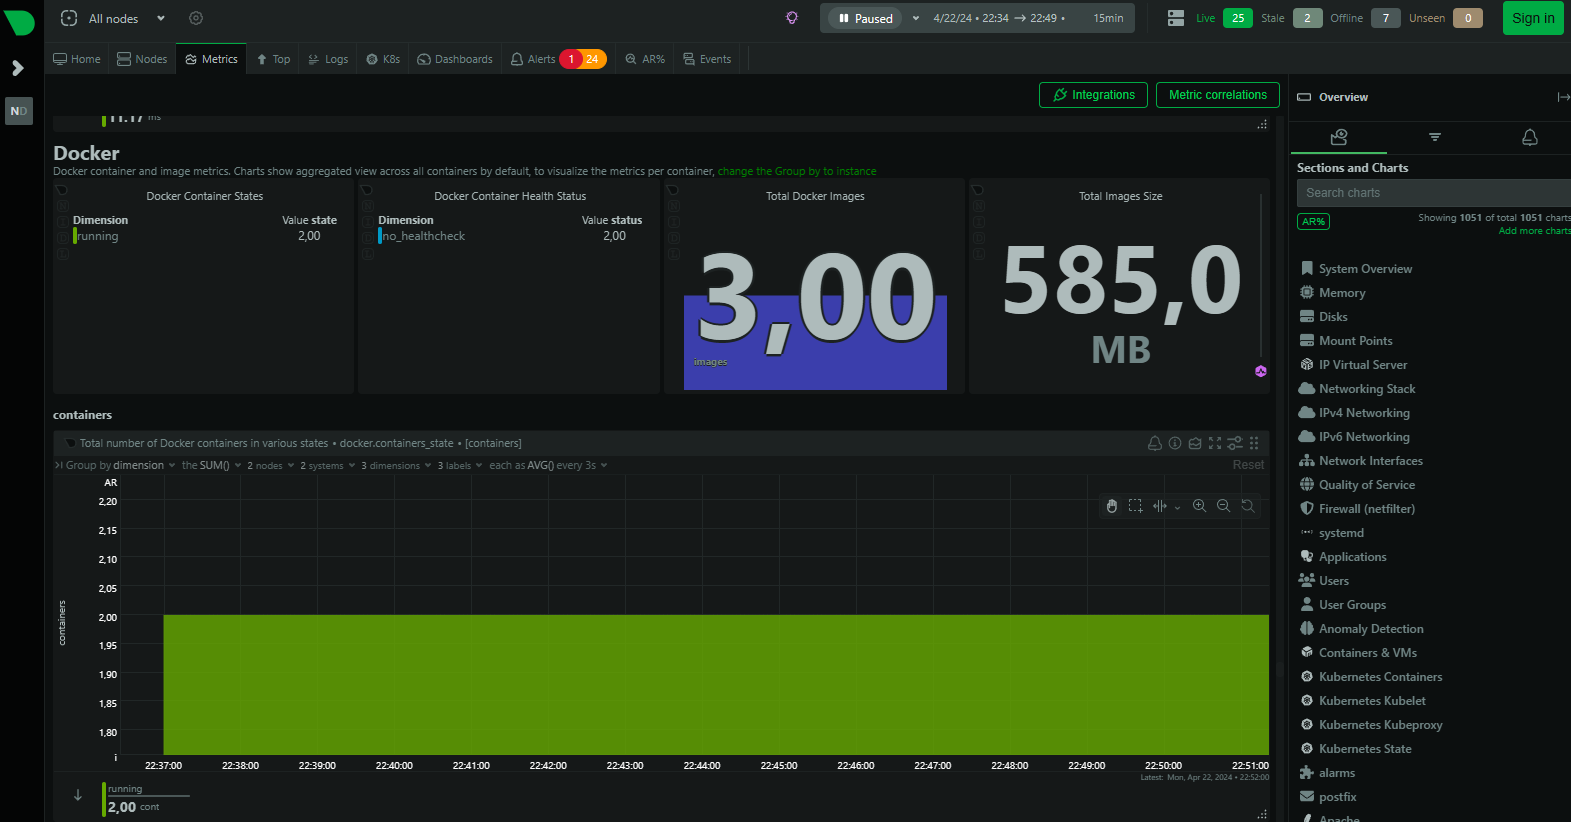
💡 Take a look at the metrics page of this example demo from Netdata. This is a provider of monitoring solutions.
On this page you can monitor the metrics of some Docker deployments:
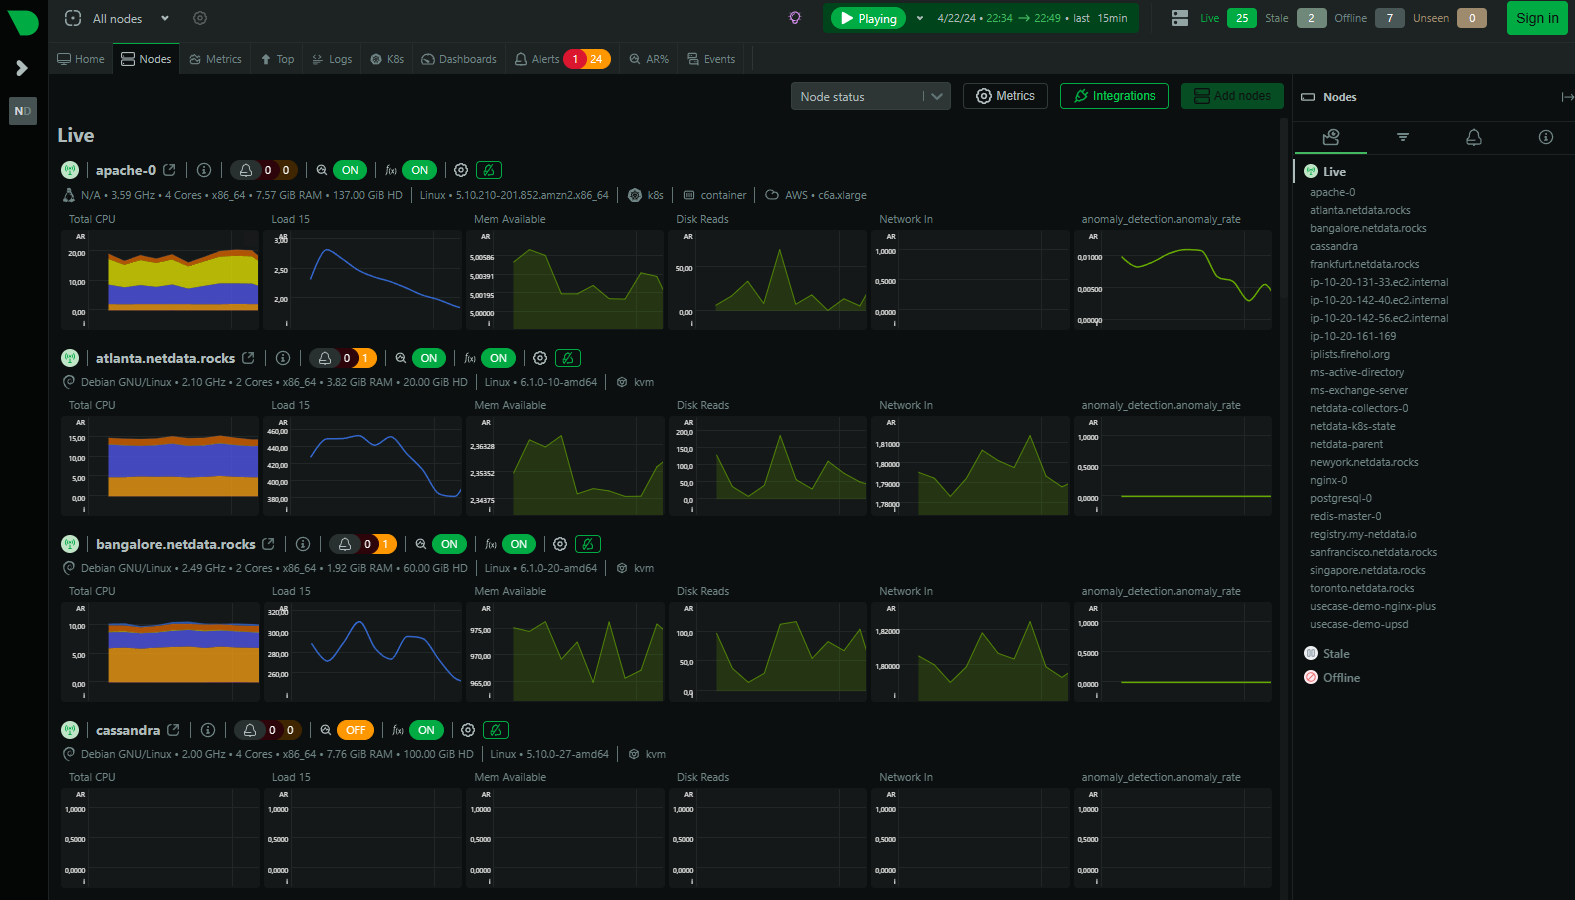
You can also take a look at the nodes, the various systems that are being monitored, with related general metrics that are available for all types of systems like memory available:
🛠 A practical example with Prometheus
![]() Prometheus is an open-source systems monitoring and alerting toolkit that was originally built at SoundCloud. It's now a standalone project designed to collect and store metrics as time series data, which means that metrics information is stored with the timestamp at which it was recorded, along with optional key-value pairs called labels.
Prometheus is an open-source systems monitoring and alerting toolkit that was originally built at SoundCloud. It's now a standalone project designed to collect and store metrics as time series data, which means that metrics information is stored with the timestamp at which it was recorded, along with optional key-value pairs called labels.
Main Features of Prometheus:
Metrics Collection:
- Prometheus collects data from various targets (services, applications, servers, etc.) over time. These targets expose metrics via an HTTP endpoint.
- Example: Suppose you have a web server. Prometheus scrapes metrics like request count, response time, and error rate from the server's
/metricsAPI endpoint.
Flexible Queries (PromQL):
- PromQL (Prometheus Query Language) allows you to query and manipulate your collected data.
- Example: You can use PromQL to calculate the average response time over the last hour or find the top 5 endpoints with the highest error rate.
Stand-alone and Local Storage:
- Prometheus doesn't rely on external databases. It stores data locally in its own time series database.
- Example: Even if your network goes down, Prometheus continues to collect and store metrics.
Pull Model:
- Prometheus pulls data from targets at regular intervals (configured via
scrape_interval). - Example: Every 15 seconds, Prometheus fetches CPU usage, memory consumption, and other metrics from your application.
- Prometheus pulls data from targets at regular intervals (configured via
Configurable Targets:
- You define which targets Prometheus should scrape. This can be done statically or via service discovery.
- Example: In your
prometheus.yml, you specify that Prometheus should scrape metrics from your FastAPI app atlocalhost:8000.
Now, let's tie this to an example setup:
- Suppose you have a FastAPI application serving an API. You've instrumented it using Prometheus client libraries.
- The FastAPI app exposes metrics at
localhost:8000/metrics. - Prometheus scrapes these metrics regularly (every 15 seconds) and stores them.
- You can query these metrics using PromQL. For instance, you might want to know the total number of requests or the average response time.
- This will be used by Grafana, which will query Prometheus to create metrics information on a dashboard.
To achieve this, our setup with with Prometheus, Grafana, and FastAPI will look like this:
FastAPI application:
- Exposes metrics at
localhost:8000/metrics. - Prometheus can scrape this endpoint to collect data.
- Exposes metrics at
Prometheus to collect metrics:
- It scrapes data from predefined targets, in this case our FastAPI appliction.
- Stores this data for querying and alerting.
Grafana for visualization:
- Connects to Prometheus and queries the stored data.
- Lets you create dashboards to visualize the data.
Create an empty folder for our example called fastapi-prometheus-grafana. Create three subfolders in this folder:
📂 fastapi-prometheus-grafana
├── 📂 app
├── 📂 grafana
└── 📂 prometheus
🛠 Practical example with Prometheus step 1: The FastAPI application in the 📂 app subfolder
Go to the 📂 app subfolder and create a new FastAPI application inside of it with a main.py that looks like this:
from fastapi import FastAPI
from fastapi.middleware.cors import CORSMiddleware

app = FastAPI()


@app.get("/")
def home():
    return "Hello World"


app.add_middleware(
    CORSMiddleware,
    allow_origins=["*"],
    allow_credentials=True,
    allow_methods=["*"],
    allow_headers=["*"],
)
As you can see this is a simple FastAPI example with one endpoint.
Now we will make sure this API exposes a /metrics endpoint that provides the needed data for Prometheus to scrape. We will do this by including the prometheus_fastapi_instrumentator library. Take a look at the documentation for it here.
By including the Instrumentator().instrument(app).expose(app) line provided by this library we will expose our API's metrics at localhost:8080/metrics.
Edit the main.py:
from fastapi import FastAPI
from fastapi.middleware.cors import CORSMiddleware
from prometheus_fastapi_instrumentator import Instrumentator

app = FastAPI()


@app.get("/")
def home():
    return "Hello World"


app.add_middleware(
    CORSMiddleware,
    allow_origins=["*"],
    allow_credentials=True,
    allow_methods=["*"],
    allow_headers=["*"],
)


Instrumentator().instrument(app).expose(app)
Install the library by using:
pip install prometheus_fastapi_instrumentatorThen run the application and check the http://127.0.0.1:8000/metrics endpoint for yourself. Make some requests to the base http://127.0.0.1:8000/ endpoint and refresh your metrics endpoint to see if something changes.
Lastly we will make it so that this API can be put into a container. To do this create the following Dockerfile:
FROM python:3.10
WORKDIR /app/
COPY . .
RUN pip install -r requirements.txt
EXPOSE 8000
CMD ["uvicorn", "main:app", "--host", "0.0.0.0", "--port", "8000", "--reload"]
And then create the requirements.txt needed to install the libraries during the Docker build:
prometheus-fastapi-instrumentator
uvicorn
fastapi
🛠 Practical example with Prometheus step 2: Prometheus configuration in the 📂 prometheus subfolder
In this folder we will create a .yml file that will give a Prometheus container the needed configuration.
Create a file named prometheus.yml:
global:
  scrape_interval: 15s

scrape_configs:
  - job_name: 'prometheus'
    scrape_interval: 15s
    metrics_path: /prometheus/metrics
    static_configs:
      - targets: ['localhost:9090']
  - job_name: 'app'
    scrape_interval: 5s
    static_configs:
      - targets: ['app:8000']
This file contains the following configurations:
global:
  scrape_interval: 15s
The global block sets default settings for all scrapes. scrape_interval is set to 15s, meaning Prometheus will collect metrics from targets every 15 seconds.
scrape_configs:
  - job_name: 'prometheus'
    scrape_interval: 15s
    metrics_path: /prometheus/metrics
    static_configs:
      - targets: ['localhost:9090']
The first scrape_config is for scraping metrics from Prometheus itself (job_name: 'prometheus'). It has the same scrape_interval as the global setting. The metrics_path indicates the path to fetch metrics from, and static_configs specifies the targets to scrape, with Prometheus scraping its own metrics from localhost:9090.
  - job_name: 'app'
    scrape_interval: 5s
    static_configs:
      - targets: ['app:8000']
The second scrape_config is for an application named 'app'. It has a scrape_interval of 5s, so Prometheus will collect metrics from this application every 5 seconds. Since a metrics_path is not specified for the 'app' job, Prometheus will use the default path, which is /metrics. Therefore, Prometheus will scrape metrics from app:8000/metrics. The targets under static_configs specifies that the application exposes metrics at app:8000. This app will be linked to our FastAPI application in the final Docker compose file.
This configuration sets up the Prometheus container that we will use to scrape metrics from itself and from an application at different intervals, which are 15 seconds for Prometheus and 5 seconds for the application. The job_name labels the scrape jobs in the Prometheus metrics for easier identification and querying. The targets specify where Prometheus should go to collect the metrics, and the metrics_path specifies the endpoint to scrape the metrics from, with a default of /metrics if not otherwise specified.
🛠 Practical example with Prometheus step 3: Grafana configuration in the 📂 grafana subfolder
Grafana will need a little more configuration than our other two components. Download the contents for this folder from here (right-click Save-as) and unzip them inside the 📂 grafana subfolder so that it looks like this:
📂grafana
├── 📄 config.monitoring
├── 📂 provisioning
    ├── 📂 dashboards
        ├── 📄 dashboard.yml
        └── 📄 fastapi-dashboard.json
    └── 📂 datasources
        └── 📄 datasource.yml
Take a look at each of the files in this structure:
- 📄 config.monitoring: Sets up our admin password and makes it impossible to create new signups.
- 📄 datasource.yml: Configures our Prometheus as a datasource for Grafana so that it can take that data and we can put it into a dashboard.
- 📄 dashboard.yml: Configures Grafana to look for dashboard configurations in the
📂 provisioning / 📂 dashboardsfolder. - 📄 fastapi-dashboard.json: Contains the entire configuration, structure and settings for a dashboard, in code. Based on this Grafana will create a dashboard.
🛠 Practical example with Prometheus step 4: Docker compose in the main 📂 fastapi-prometheus-grafana folder
Create a docker-compose.yaml file in the main 📂 fastapi-prometheus-grafana folder to deploy all our components together:
services:
  app:
    build:
      context: ./app
    restart: unless-stopped
    container_name: app
    ports:
      - 8000:8000
    networks:
      example-network:
        ipv4_address: 172.16.238.10

  prometheus:
    image: prom/prometheus:latest
    restart: unless-stopped
    container_name: prometheus
    ports:
      - 9090:9090
    volumes:
      - ./prometheus/prometheus.yml:/etc/prometheus/prometheus.yml
    networks:
      example-network:
        ipv4_address: 172.16.238.11

  grafana:
    image: grafana/grafana
    container_name: grafana
    restart: unless-stopped
    depends_on:
      - prometheus
    ports:
      - 3000:3000
    volumes:
      - ./grafana/provisioning:/etc/grafana/provisioning
    env_file:
      - ./grafana/config.monitoring
    networks:
      example-network:
        ipv4_address: 172.16.238.12

networks:
  example-network:
    name: example-network
    driver: bridge
    ipam:
      driver: default
      config:
        - subnet: 172.16.238.0/24
This Docker Compose file defines a multi-container Docker application with three services: app, prometheus, and grafana, each with specific configurations:
services: Defines the containers that make up your application.
- app:
- build: This service is built from a Dockerfile located in the
./appdirectory. So now you also learn that a Docker Build operation can also be triggered and done by adocker compose upcommand like this! - restart: The container will restart if it stops unless it is explicitly stopped.
- container_name: The name of the running container is set to "app".
- ports: Maps port 8000 of the container to port 8000 of the host.
- networks: Assigns the container an IP address within the
example-network.
- build: This service is built from a Dockerfile located in the
- app:
Linking containers by reference
The app:8000 that we wrote in the second scrape_config of the prometheus.yml file references this app in the docker compose.yaml file. Prometheus will thus link to this container!
prometheus:
- image: Uses the latest Prometheus image from Docker Hub.
- restart: The container will restart if it stops unless it is explicitly stopped.
- container_name: The name of the running container is set to "prometheus".
- ports: Maps port 9090 of the container to port 9090 of the host.
- volumes: Mounts the local
./prometheus/prometheus.ymlfile to/etc/prometheus/prometheus.ymlinside the container. This will make sure that the configuration we provided get loaded in by the Prometheus container. - networks: Assigns the container an IP address within the
example-network.
grafana:
- image: Uses the Grafana image from Docker Hub.
- container_name: The name of the running container is set to "grafana".
- restart: The container will restart if it stops unless it is explicitly stopped.
- depends_on: Specifies that
grafanadepends on theprometheusservice. - ports: Maps port 3000 of the container to port 3000 of the host.
- volumes: Mounts the local
./grafana/provisioningdirectory to/etc/grafana/provisioninginside the container. - env_file: Uses the environment variables defined in
./grafana/config.monitoring. - networks: Assigns the container an IP address within the
example-network.
networks: Defines the network configuration for the containers.
- example-network:
- name: The name of the network is set to "example-network".
- driver: Uses the bridge driver for Docker networking.
- ipam:
- driver: The default IP address management driver is used.
- config: Defines the subnet for the network, which is
172.16.238.0/24in this case.
- example-network:
This setup allows the app service to run an application, prometheus to monitor the application's metrics, and grafana to visualize those metrics. Each service is assigned a specific IP address within the defined subnet, ensuring they can communicate over the example-network. The ports are mapped to allow external access to the services from the host machine. The volumes and environment files are used to configure the services with the necessary settings and data.
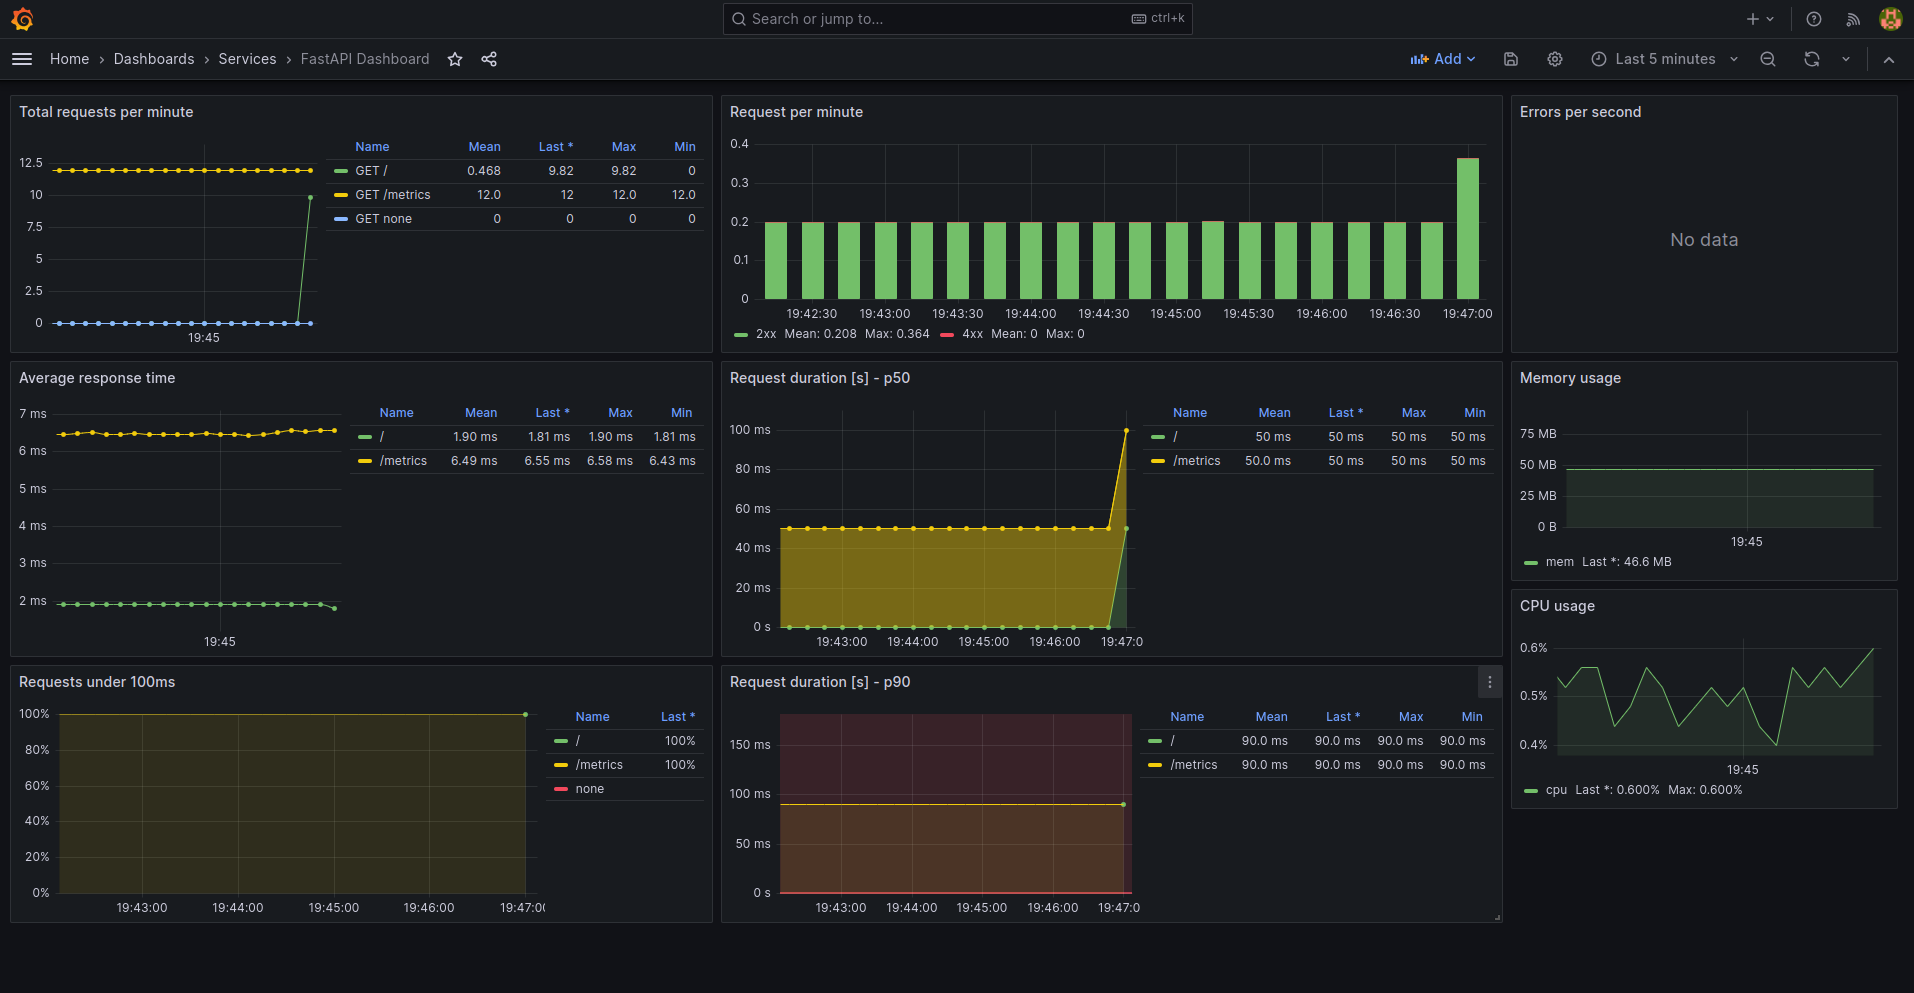
Now try and run your setup with docker compose up.
You should be able to access the Grafana instance at localhost:3000 with the credentials admin and abc123, and the FastAPI application at localhost:8000.
Take a look at the metrics on the dashboad and try to make a number of requests to the API by refreshing your browser at localhost:8000.
Key Performance Indicators (KPIs) and the SLA
After considering these basic preformance metrics, we can then talk about Key Performance Indicators (KPIs) as metrics, which are tied to demands the customer has for our application and are crucial for evaluating the success of the API in meeting those goals for the users. The three important KPIs for API monitoring might include:
- Response Time: A direct indicator of user experience, as it measures the time an API takes to process and return a response.
- Error Rate: Represents the stability and reliability of the API by showing the percentage of requests that result in an error.
- Availability: Indicates the percentage of time the API is operational and accessible, which is critical for user reliance.
These KPIs are explicitly tied to Service Level Agreements (SLAs). SLAs are formal contracts with terms of service between the IT application or system provider and the customer. They including things like availability, reliability, and performance standards that the IT provider promises to uphold.
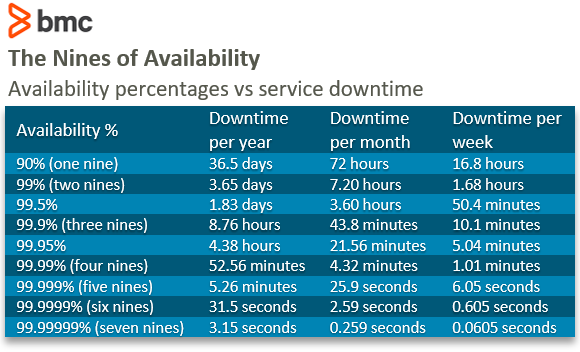
Service Level Agreements (SLAs) are built upon Service Levels and provide concrete examples for these operational standards. For instance, an SLA may specify these Service Levels:
- the Response Time of an API call should not exceed 300 milliseconds
- the Error Rate should be below 1% for all API calls measured over a month
- the Availability should be at least 99.95% measured over a month
KPI's are explicitly tied to Service Levels like these. By tracking both these operational metrics and KPIs, and aligning them with Service Levels, organizations can ensure their APIs are not only meeting contract goals but are also maintained effectively and efficiently.
Service Levels, especially through SLAs, help in quantifying the expectations and obligations of both the IT provider and customer, making the KPIs and monitoring a critical component in managing the contract.
If these SLAs are not met, there are typically remediation steps or penalties outlined within the agreement like financial compensation. For example, if the Availability falls below the agreed threshold, the provider might have to issue a discount to the customer for the next payment term.
🚨 Alerts
Alerts can be based on both Metrics and Logs. They often rely on Metrics to trigger notifications when performance indicators fall outside of acceptable ranges. For example, an alert may be set up to notify the team if CPU usage exceeds 90% for a certain period.
Similarly, Alerts can be generated from Logs when specific error messages or event patterns are detected, indicating a potential issue that requires attention.
💡 Take a look at the alerts page of this example demo from Netdata.
When looking at the alerts page of the Netdata monitoring solution you can see the different status levels of the alerts, similar to what you saw in the Python logging library:
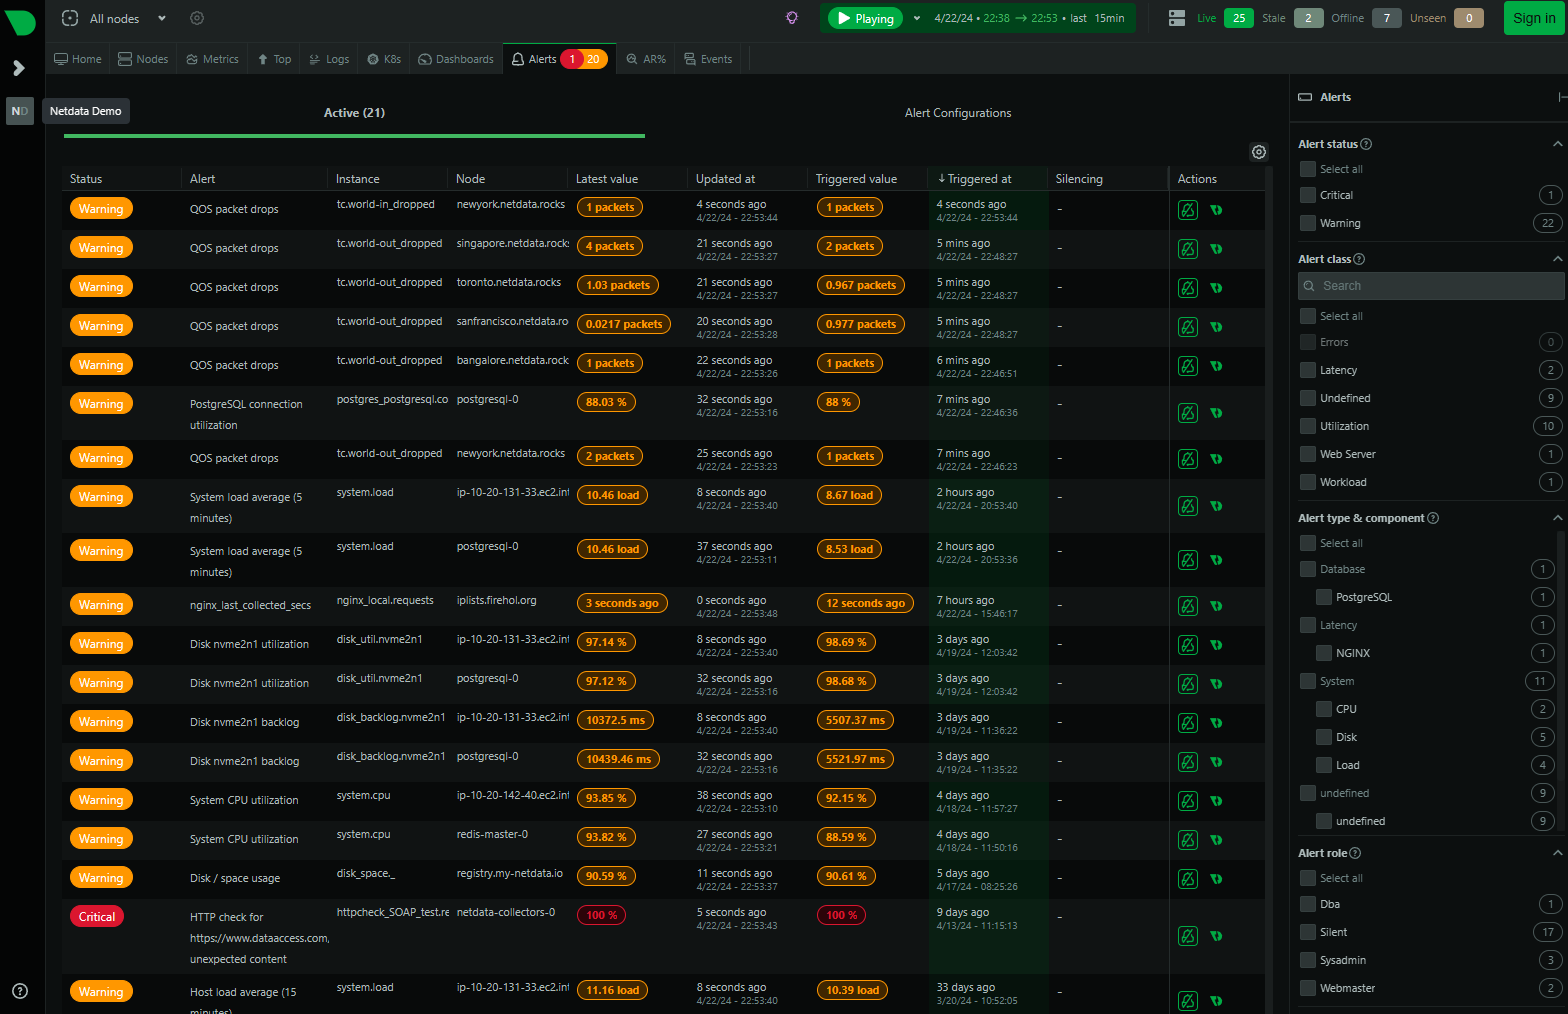
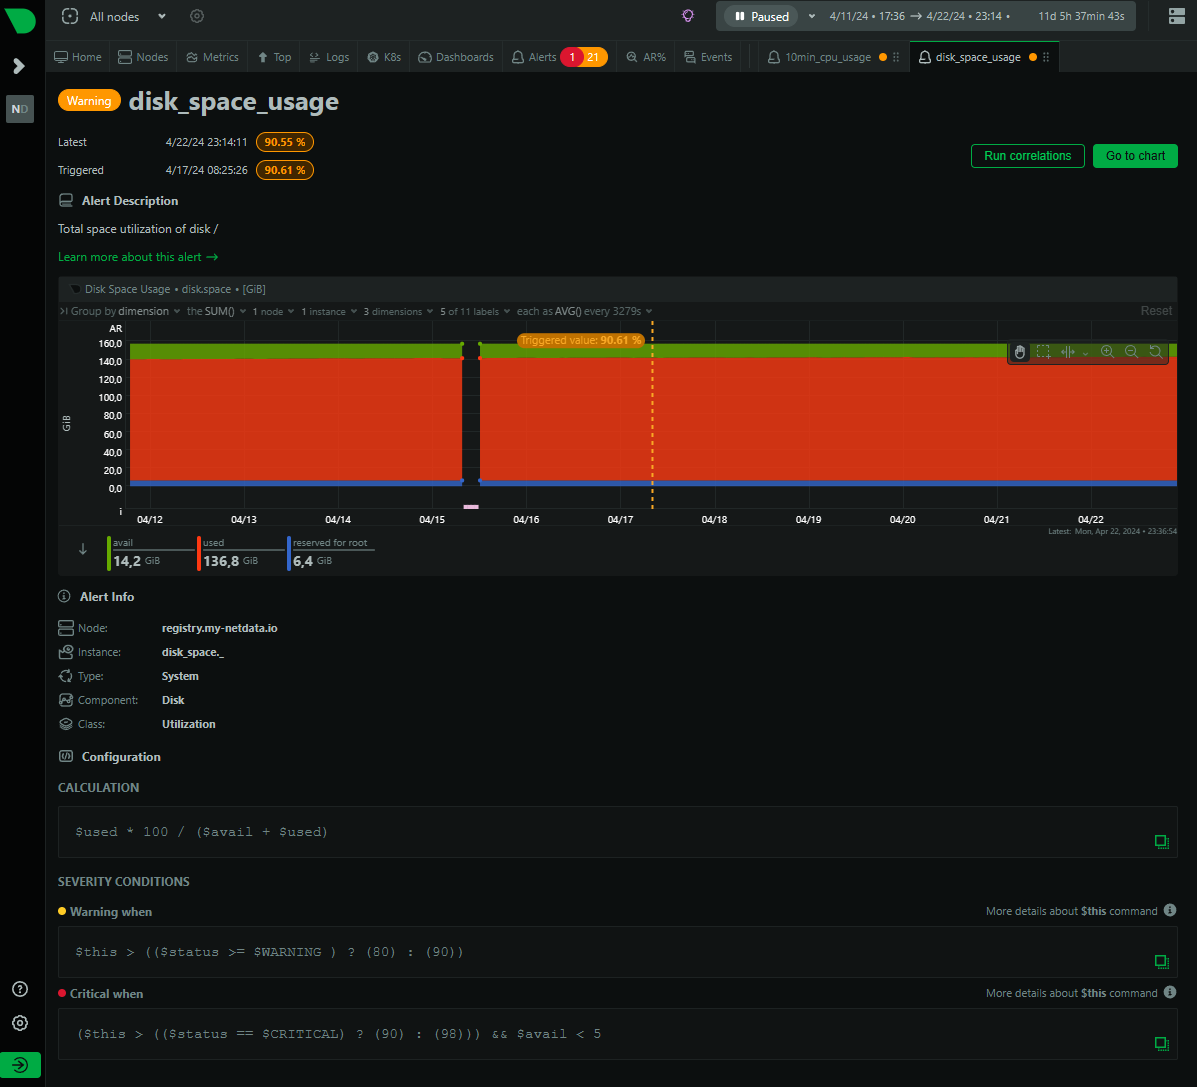
When you then click on the name in the Alert column, and click on the View alert page button on the bottom right you can view the alert in detail.
For example this alert was triggered on the metric of Disk Space Usage going higher than the threshold defined in the Severity conditions. Try and figure out why this alert is only Warning and not Critical:
You will look at alerts from Python logging more in detail yourself during the 🕹 Challenges & Exploration.
Closing thoughts
By using Logs, Metrics and Alerts a team can provide a comprehensive mechanism for maintaining system health and performance.
Logs give detailed information about individual events, Metrics provide a broader view of the system's performance over time, and Alerts notify when immediate action is needed based on the data from Logs and Metrics. Together, they enable DevOps teams to keep their systems running smoothly and efficiently.